Turbine Monitoring Dashboard
Asset Management Software, Web & Mobile App
Client
EWT
Tools
Java
OPC-UA
Javascript
WebSockets
Highcharts
Backbone.js
AWS
Brief
EWT, a leading wind turbine supplier for distributed wind energy applications, needed a bespoke, easy-to-use web portal that would allow their customers to go online and login to a secure system, monitor how their turbines were functioning in real time, and download statistics and reports from any location. Clients also needed to be able to stop and start their turbines remotely, using the portal.
Challenges & Solutions
Each EWT turbine PLC runs an industrial OPC UA server, which presents live turbine data only accessible by authorised systems.
Brave had to find a way to transmit the live data from each turbine to EWT’s clients in a visually pleasing way in real time on the Internet.
To get the data from each unit, we wrote a custom Java Internet server that dials into every turbine, pulls its data in real time, then reconfigures it into a web-friendly format. Clients then log on to view a sleek and accessible dashboard, with easy-to-use and access features.
We built this server to run in the cloud, ensuring that it’s able to handle any amount of connected turbines.
The Java server is lean and efficient. When nobody is using the app, it goes into sleep mode, saving computing power and traffic. To this end, it only spins up the per-second, real-time data for each specific turbine when a user opens the app to look at it.
The Dashboard
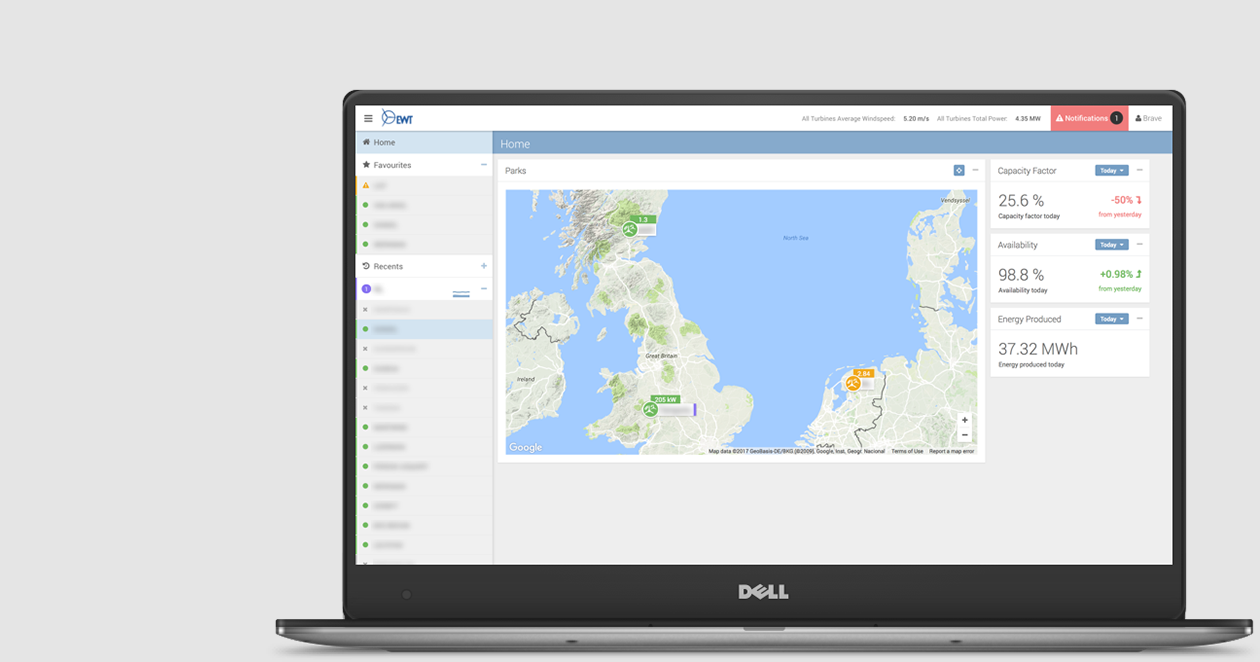
A custom-built app, written in Backbone javascript and using WebSockets, streams the gathered data from the Java server back to a web-browser and the user.
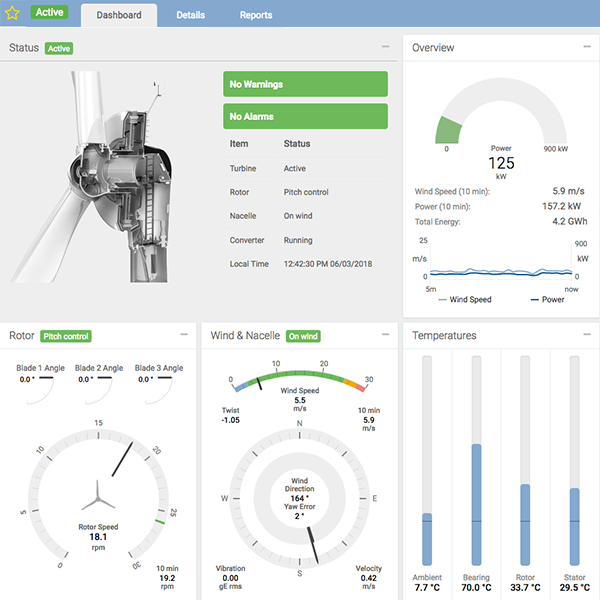
The EWT dashboard offers customers a real time view of multiple turbines, their statuses and power outputs, all on a single map, with all the metrics displayed in an easy-to-understand summary.
The app has robust systems in place to handle sessions and users (including settings and authentication), high-detail, low-detail, and lost connections.
Animated Graphs
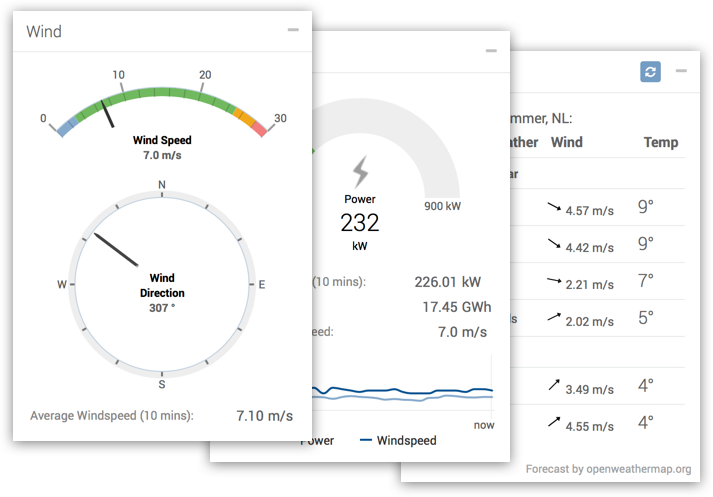
To represent the data eloquently without bombarding the user with information, we custom-built a number of different graphs, charts, dials and gauges using Highcharts. These all update dynamically as data is sent down the WebSockets pipe.
Each turbine component has an animated visual graph representing its current status and output.
At a glance, engineers can see how individual components are performing in real time.
The graphs work across all platforms, from desktop to mobile, and the animations are smooth and seamless.
How can we innovate with you?
Features
- Realtime data flow from each turbine
- Lean & efficient custom-built Java server
- Scalable architecture running in the cloud
- Eloquent data visualisation
- Notifications when an event requires attention
- Minimalist and bespoke design
- Responsive on all devices
- Draggable module grid


